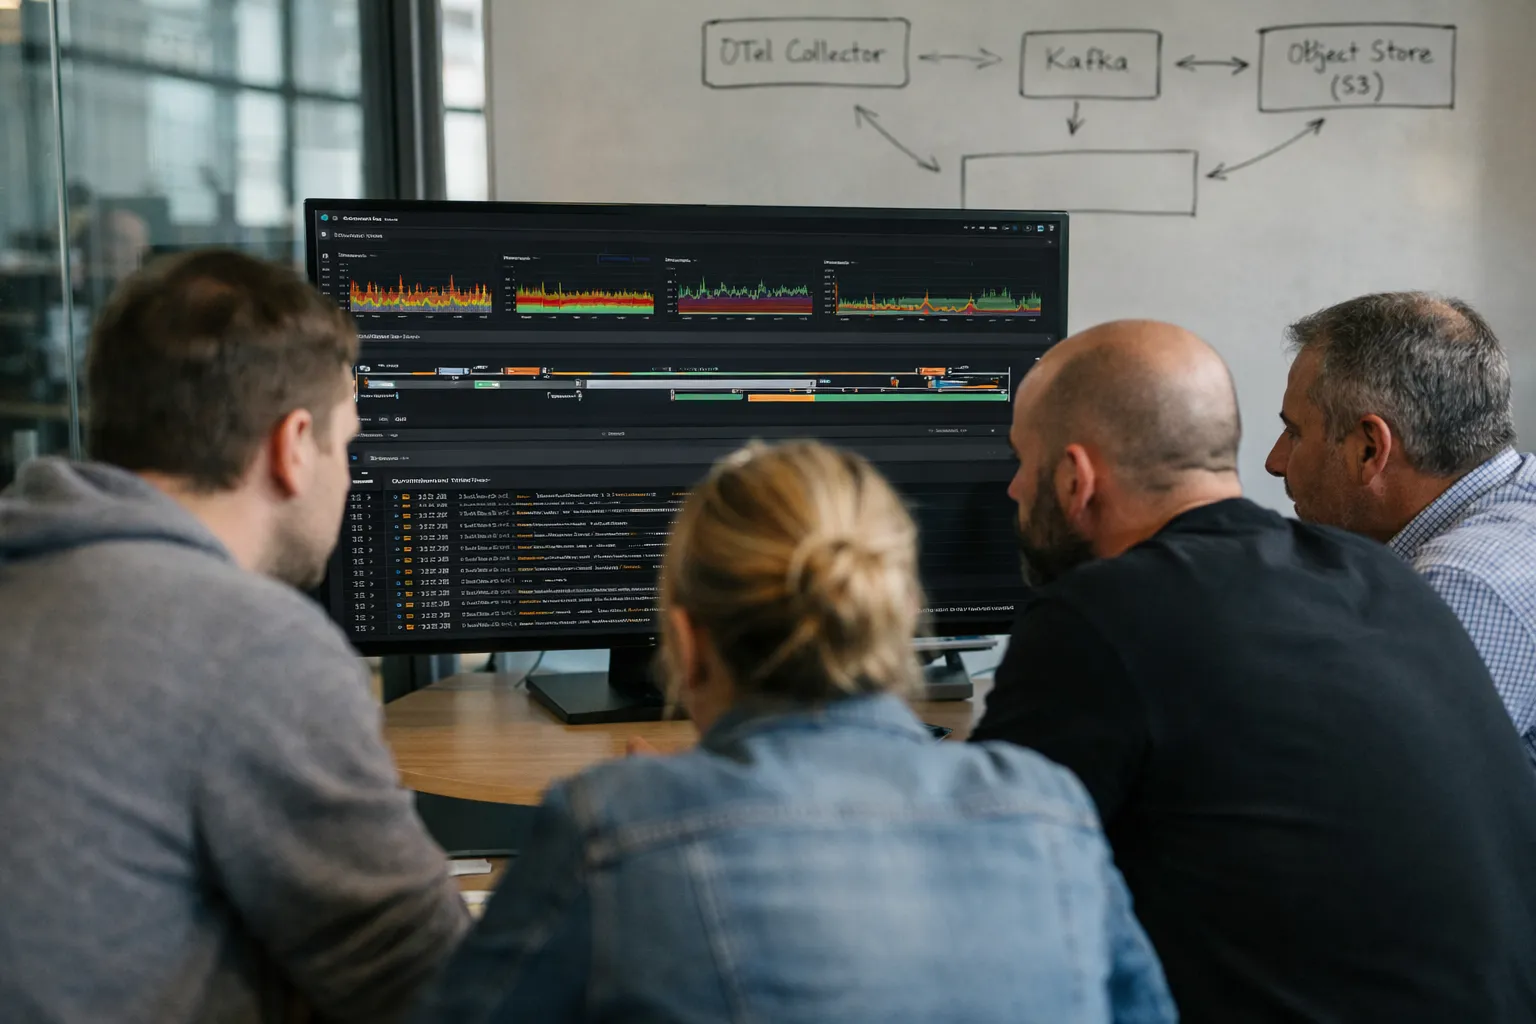
This updated guide shows engineering, platform, and SRE teams exactly how to consolidate fragmented observability into an integrated, scalable platform in September 2026. You’ll get an actionable roadmap—what to inventory, what to change in instrumentation, how to design ingestion and storage, and how to use modern tooling (eBPF telemetry, server-side sampling, and AI-assisted triage) to cut costs and improve MTTR. This is for engineering leaders, platform teams, and SREs who must deliver measurable operational ROI while reducing vendor sprawl and telemetry noise.
Prerequisites and context
Before you begin: you need access to the telemetry invoices and quotas for current vendors, a simple inventory of services (owner, environment, telemetry types produced), and a cross-functional sponsor (platform or SRE) with authority to enforce standards. Technical prerequisites include OpenTelemetry-compatible SDKs in your primary languages, a CI pipeline that can run instrumentation checks, and at least one environment (staging or low-risk production) to pilot new pipelines.
Why update now (September 2026)? The broad industry trends that matter for consolidation:
- OpenTelemetry is the de facto telemetry wire protocol across cloud and vendor ecosystems; using it reduces lock-in and simplifies multi-backend migration.
- Observability at scale increasingly uses OS-level capture (eBPF) for high-fidelity, low-overhead metrics and network traces—useful for legacy services you cannot easily instrument.
- AIops and LLM-assisted triage are now a standard capability in many platforms, helping prioritize alerts and suggest remediation steps, but they require consistent, high-quality telemetry to be effective.
- Telemetry costs and egress considerations remain a top CFO concern; effective sampling, aggregation, and data contracts are essential to make consolidation affordable and defensible.
High-level approach (updated)
- Assess state, costs, and business impact (add telemetry SLAs to scorecards)
- Define explicit telemetry data contracts and policy-as-code for sampling and retention
- Standardize instrumentation with OpenTelemetry + centralized libraries and eBPF for opaque hosts
- Build resilient Collector topology with policy routing, server-side sampling, and enrichment
- Choose tiered storage and a unified query/AIops front-end
- Integrate with CI/CD, incident workflows, runbooks, and financial reporting
- Run pilots, dual-write, and phased migration; measure and report ROI
Step 1 — Assess: inventory, costs, and business value
Update your inventory to include:
- Telemetry types per service (metrics, logs, traces, events, packet captures) and their cardinality drivers.
- Production ingestion rates (events/sec or samples/sec) and monthly volumes per vendor; include egress/egress-transfer fees when data crosses cloud accounts.
- Retention windows per use case and legal/regulatory constraints (data residency, PII rules).
- Business-critical use cases and their performance requirements—e.g., SLOs for customer-facing APIs, fraud detection latency, and batch-job observability for SLAs to partners.
Deliverables:
- Spreadsheet of sources, volumes, owners, vendor costs, and retention obligations.
- Prioritized use cases mapped to business outcomes and financial impact (hourly cost of incidents, revenue exposure by service).
Step 2 — Data strategy: contract-first telemetry
Through 2026, the most effective teams treat telemetry like product data: codify "data contracts" that define what a service must emit and what teams may not emit. Your data strategy should include:
- Classification: hot (real-time, 7–30 days), warm (analytics, 90–180 days), cold (compliance, 365+ days).
- Data contracts: per-service schema with required resource attributes (team, service_name, environment, deployment_id), allowed labels, and cardinality limits.
- Policy-as-code: express sampling, retention, and redaction rules in version-controlled policy files that the Collector enforces.
- Sampling strategy: combine probabilistic sampling for high-throughput services with tail-based sampling for error preservation. Where possible, implement server-side sampling in Collector tiers to avoid exporting unnecessary payloads and vendor costs.
- PII handling: redact or tokenize at the Collector to minimize legal exposure; prefer hashed identifiers rather than raw PII.
Step 3 — Standardize instrumentation
Standardization remains the single biggest multiplier. Updated best practices:
- Adopt OpenTelemetry semantic conventions and publish your enterprise extension guidelines (service tags, environment names, release metadata).
- Provide enterprise libraries and wrappers for common languages that enforce resource attributes, sampling config, and safe defaults.
- Use CI checks and pre-merge tests that validate telemetry contracts: static analyzers, unit tests that assert required tags, and runtime guards that prevent high-cardinality labels from being emitted.
- Where code changes are impossible (legacy, vendor binaries), use eBPF-based collectors to extract network-level metrics, HTTP semantics, and latency distributions without application changes.
Step 4 — Build the ingestion pipeline (Collector topology and patterns)
OpenTelemetry Collector remains the standard ingestion and transformation layer. Updated deployment recommendations:
- Agent layer: language SDKs where possible; sidecar or node-level Collector agents for Kubernetes; system-level eBPF probes for host-level observability.
- Centralized processing tier: a scalable, multi-tenant Collector cluster (Kubernetes) that performs enrichment, attribute processing, server-side sampling, and routing.
- Policy routing: route streams by classification (hot analytics, traces, long-term logs) and apply different processors per route (indexing, aggregation, sampling).
- Dual-write pattern: during migration, use parallel exporters but limit dual-write duration; measure parity and cost delta frequently.
- Backpressure and resilience: use bounded queues, autoscaling by queue depth, and fallback exporters to local object storage if remote backends become unavailable.
Sizing notes: autoscale Collector replicas by CPU, memory, and queue latency. Use batch exporters and tune time/size to match backend throughput. Plan for periodic bursts (deploy windows, sales events) with temporary autoscaling or buffer-to-object-store policies.
Step 5 — Storage and query architecture
Best-fit backend decisions in 2026 are hybrid: combine managed SaaS front-ends or query layers with self-hosted long-term stores to control spend.
- Metrics: Prometheus-compatible TSDB with long-term storage (Thanos/Cortex/Mimir) or managed metric stores for cardinality-heavy workloads.
- Logs: tiered index—hot indexed storage for 7–30 days; warm analytics store for 90–180 days; cold compressed objects in S3/GCS for compliance.
- Traces: store full spans for recent windows with indexed search and archive older spans in cheaper object stores; prefer trace stores that support tail-sampling and rehydration of archived traces for forensic analysis.
- Unified query and AIops: use a query layer (Grafana, Honeycomb, vendor platforms) that can federate across backends and feed AI-assisted triage tools for alert prioritization.
Architecture tip: prefer backends that support columnar compression or delta encoding for metrics and logs to reduce storage costs; benchmark query performance for your most common queries before committing.
Step 6 — Integration: incident, CI/CD, and business systems
Observability succeeds when tightly coupled to operational workflows:
- CI/CD: emit deployment annotations, feature flags, and canary signals to correlate deploys with SLO shifts.
- Incident management: SLO-based routing to on-call, with automated escalation rules and contextual bundles (linked traces, logs, recent deploy metadata).
- Runbooks and borg: have runbooks versioned with code; use observability links in tickets and automate remediation where safe (e.g., circuit breakers).
- Finance and business metrics: expose cost dashboards that map telemetry ingestion to team budgets and customer impact—use this to negotiate telemetry quotas during sprint planning.
Step 7 — Security, governance, and compliance
Security and governance must be embedded at ingest:
- Access control: fine-grained RBAC and attribute-based access to telemetry datasets; use just-in-time access for sensitive logs.
- Encryption and key management: encrypt in transit and at rest; manage keys with existing enterprise KMS and audit key rotation.
- Auditability: retain telemetry catalogs and policy-change logs for audits; generate attestation artifacts that show redaction steps taken at ingest.
- Privacy: implement robust PII redaction rules in Collector processors and validate them with automated tests.
Step 8 — Cost optimization (practical tactics)
Cost control is about signal, not minimum spend. Practical tactics that work in 2026:
- Enforce cardinality limits per metric and service via policy-as-code; block or alert on spikes.
- Prefer pre-aggregation: emit histograms and aggregates rather than per-request counters where possible.
- Server-side sampling: move sampling and enrichment into central Collectors to avoid vendor ingress charges.
- Selective indexing: index only fields used for alerting and searches; make other fields retrievable but non-indexed.
- Archive cold data cheaply in compressed object storage and provide a rehydration path for occasional forensic queries.
- Run monthly cost simulations that model different retention and sampling scenarios and translate into budget requests for stakeholders.
Step 9 — Migration and rollout (iterative)
- Pilot: pick a critical-but-contained service with representative telemetry and clear owner alignment.
- Dual-write: run exporters in parallel for parity checks; measure alert fidelity, query latency, and costs during this window.
- Parallel run and compare: run experiments comparing MTTR, false-positive rates, and dashboard parity for pilot vs legacy.
- Enforce: roll instrumentation libraries into templates and CI gates; gradually decommission legacy agents after teams pass parity checks.
- Scale: move to next wave of services prioritized by business impact and telemetry volume.
Step 10 — Measure ROI and operational KPIs
Make ROI explicit and repeatable. Baseline these before consolidation:
- MTTD and MTTR per service and incident type.
- Monthly telemetry spend by vendor and team (ingest, storage, query, and egress).
- Number of actionable alerts per week and alert-to-incident ratio.
- Incident hours by severity and estimated revenue impact.
After consolidation, measure improvements and translate them into financial terms—reduced incident hours, lower vendor bills, fewer escalations. Produce a quarterly observability scorecard for business stakeholders that ties uptime, incident cost, and telemetry spend together.
Common mistakes and mitigations (updated)
- Over-centralizing: avoid making the observability system a single operational dependency. Mitigate with multi-region replication, fallback exporters, and SLOs for the observability stack itself.
- Rigid sampling: do not use overly aggressive sampling without tail preservation—use hybrid sampling (probabilistic + tail-based) and validate with post-sampling checks.
- Ignoring developer experience: standardized libraries must be easy to adopt. Provide templates, automation, and a migration playbook to reduce friction.
- Underestimating egress: model cross-account and cross-cloud egress costs early; prefer pre-ingest reduction to avoid large bills.
Pro tips
- Treat observability like a product: appoint an owner, add SLAs, and publish a public roadmap so teams can plan migrations.
- Use eBPF for services you cannot change; it captures network semantics and latency without app code changes and reduces instrumentation debt.
- Integrate AIops carefully: LLM-driven suggestions are powerful for triage but require curated telemetry contexts and guardrails to avoid hallucinated remediations.
- Run "telemetry drills": periodic tests that simulate outages and validate that the consolidated system surfaces the same or better diagnostics than legacy tools.
Example timeline (updated for a midsize enterprise, 6–9 months)
- Month 1: assessment, stakeholder alignment, select pilot, define data contracts.
- Month 2–3: pilot instrumentation, deploy Collector topology, enable server-side sampling.
- Month 3–5: validate dual-write parity, pilot incident drills, iterate on data contracts and sampling.
- Month 5–7: phased migration of teams, enforce CI checks, begin legacy decommissioning.
- Month 7–9: complete decommissioning, finalize ROI report, continuous optimization rhythms.
Checklist for engineering leaders
- Inventory telemetry sources, costs, and owners; publish a telemetry scorecard.
- Define data contracts and policy-as-code for sampling, cardinality, and retention.
- Adopt OpenTelemetry and provide enterprise SDKs and eBPF probes where needed.
- Design Collector pipelines with server-side sampling, enrichment, and routing.
- Choose tiered storage and a federated query/AIops front-end; plan for egress and compliance constraints.
- Integrate with CI/CD, incident, and financial workflows; measure before/after KPIs and produce ROI reports.
Conclusion
Consolidating observability in 2026 is both technical and organizational. With OpenTelemetry, eBPF, policy-as-code, and AI-assisted tooling, teams can reduce telemetry spend and improve incident outcomes—but only with clear data contracts, enforceable policies, and a product mindset for the observability platform. Start with a focused pilot, enforce contracts through CI and Collector policies, and measure ROI in incident hours and cost reductions. Do the groundwork now and observability will become an operational asset, not a cost center.
FAQ
How do I decide what telemetry to keep hot vs. archive?
Classify telemetry by its operational use: hot data supports real-time alerting and on-call troubleshooting (retain 7–30 days). Warm data supports analytics and post-mortem work (retain 90–180 days). Cold data is for compliance or long-term trend analysis (retain 365+ days). Map each telemetry stream to a use case and the longest period that use case actually needs; default to shorter retention and extend only when justified by measured value.
When should I use eBPF vs. application instrumentation?
Prefer application-level OpenTelemetry instrumentation when you control the code because it offers richer context (business IDs, custom spans). Use eBPF when you cannot modify the application (third-party binaries, legacy systems) or when you need low-overhead OS-level metrics and network traces. Many teams combine both: eBPF for host/network visibility and OpenTelemetry for business-context spans.
What are the practical first steps for reducing telemetry costs without losing signal?
Start with these rapid actions: (1) implement cardinality limits and alert on breaches; (2) enable server-side sampling in Collectors with error-preserving tail sampling for traces; (3) switch expensive per-request metrics to histograms or aggregates; and (4) tier retention so only high-value data stays hot. Simulate cost impact and iterate—don’t throttle indiscriminately.
Can AIops replace SREs for incident triage?
No. AI-assisted tools can prioritize alerts, surface likely root causes, and suggest runbook steps, which reduces toil and accelerates resolution. However, they depend on good telemetry and guardrails. Human operators remain essential for judgement, complex remediation, and verifying automated suggestions.
How do I measure the observability platform's own reliability?
Treat the observability stack as a product with its own SLOs: ingestion latency, query latency for critical dashboards, and data completeness for recent windows. Monitor these SLOs, provide fallback exporters, and maintain multi-region replication for high availability. Include observability SLOs in your platform scorecard and report them alongside application SLOs.